Question
How do you create reporting only on "Insecure" or "End-Of-Life" statuses in Software Vulnerability Manager? How could you utilize your custom filters across all reporting configurations for tracking only the security statuses you are interested to know more about? This article will help you figure that out.
Answer
The answer is Smart Groups. This is the advanced reporting filtering method of the Software Vulnerability Manager that allows users to select only the specific criteria they like to filter their data against, and the resulted output would translate into customized full report based on the criteria.
Default Smart Group tracking only "Insecure" status criteria
By default, the SVM solution includes default Smart Groups for each Smart Group type. These are:
- "All Hosts" smart group under the "Host Smart Groups" menu.
- "All Products", "All Insecure", "End-of-Life Products" under the "Product Smart Groups" menu.
- "All Advisories" under the "Advisory Smart Groups" menu.
Under each of the main Smart Group categories, you'll find "Overview and Configuration".
This menu lets you create additional Smart Groups based on your custom criteria (Custom SGs).
You have a wide array of choices to pick from in three different criteria categories (host, product, SAID).
Criteria from different categories cannot be mixed up, but the choice is more than enough as it is.
For instance, the following Product Smart Group tracks products which have Threat Intelligence score higher than 0, which in reality represents the applications that carry the imminent risk of exploitation.
Example of custom tracking of Imminent Risk apps
The configuration of this custom smart group is rather simple, but yet so much effective as a filter:
Simple but effective reporting SG configuration
You can find more useful examples of different Smart Group configurations in the Software Vulnerability Manager Best-Practice Guide by Flexera available for download from this direct link at the Flexera Learning Center. You will need to login to the learning center with your Flexera Community account prior to being allowed to download the document.
So far, you've seen examples of using reporting through the core smart group functionality. This already should be helping you establish a routine method of tracking vulnerabilities of high interest to the business, and vulnerabilities with particularly high impact to your environment, by setting the appropriate filters in your groups logically to align with the scenarios you would wish to cover.
But this is not all, not at all!
Limit Dashboard Reporting only to Custom Smart Group filters
As you have created enough useful smart groups, customize your dashboard by building different profiles and saving them accordingly. This will help you switch quickly between management views and gain immediate visibility over your entire estate from different angles to help you prioritize better.
Dashboard reflecting only data filtered through Custom Smart Group criteria.
Dashboard Customization Flexibility
You can duplicate portlets when you need the same data for two different filters, or you can use totally different portlets but filter them through the same filter as the next example shows.
Using custom SGs to limit reporting against each Windows Flavor by duplicating the portlets for each build
PDF Customization with Smart Groups
You can similarly to Dashboard customize your PDF reports to only produce the data limited to the criteria of every of your configured Host and Product smart groups. The following visual example shows how to select a Smart Group as a filter, and the rest of the report configuration depends on your needs.
Select available Smart Group to apply its criteria filter directly to the PDF report configuration
After setting up the preferred Smart Group filter, go ahead and enable the level of details for your programs. Consider how much actual results the Smart Group contains because you would want to avoid issuing a report that has too many details in it against an SG that has too broad criteria applicability. This is mostly useful for concrete filtering and tracking of special cases and scenarios.
Don't select "detailed" report if you have millions of applications.
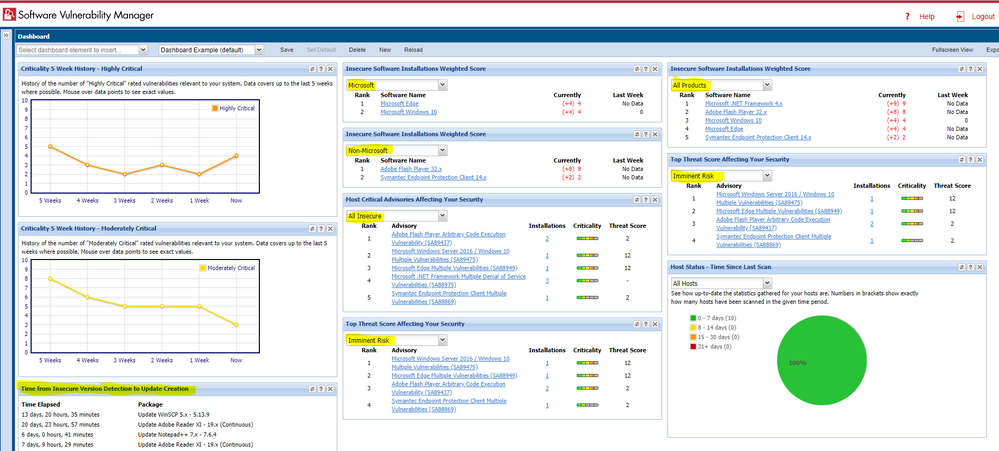
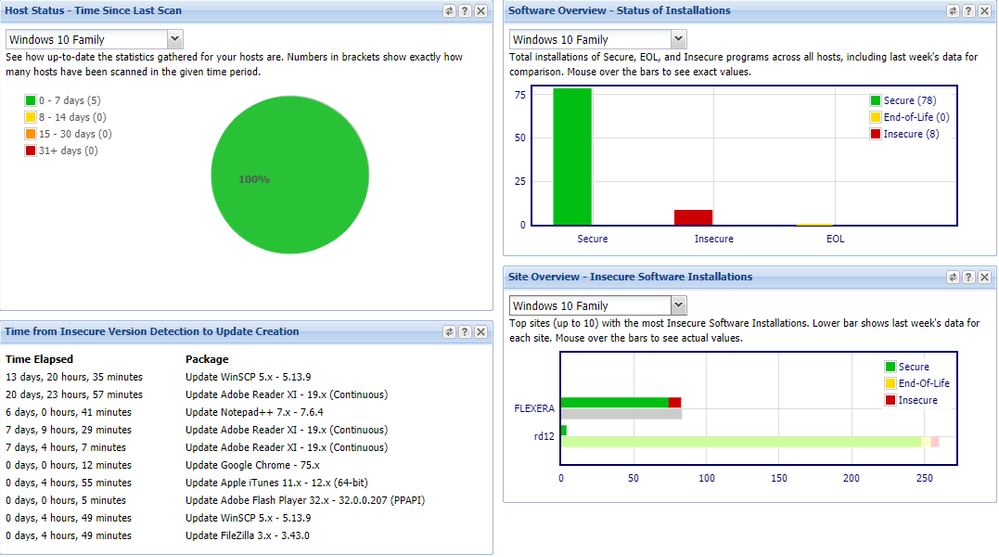
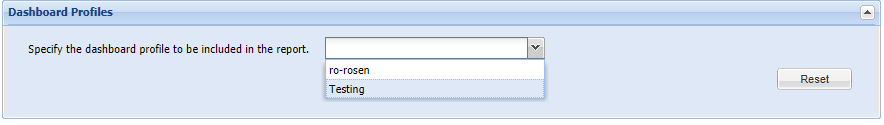
Finally, besides filtering your application details (or host ones if you used Host Smart Group filters instead), you can also include your actual Dashboard profile that stores yet another customized 'picture' of the environment that is utilizing more custom smart filters for maximum report customizations.
Tick the checkbox and enjoy adding your custom dashboard to your custom PDF report
These are the basics of achieving a very customized and useful reporting utilizing Smart Groups filters. The rest is entirely up to you to configure as much Smart Groups as you wish for as many scenarios that you find sense to monitor and diligently address. The following additional Appendix includes more useful Smart Group examples to get you started.
Appendix A - More Custom Smart Group Examples
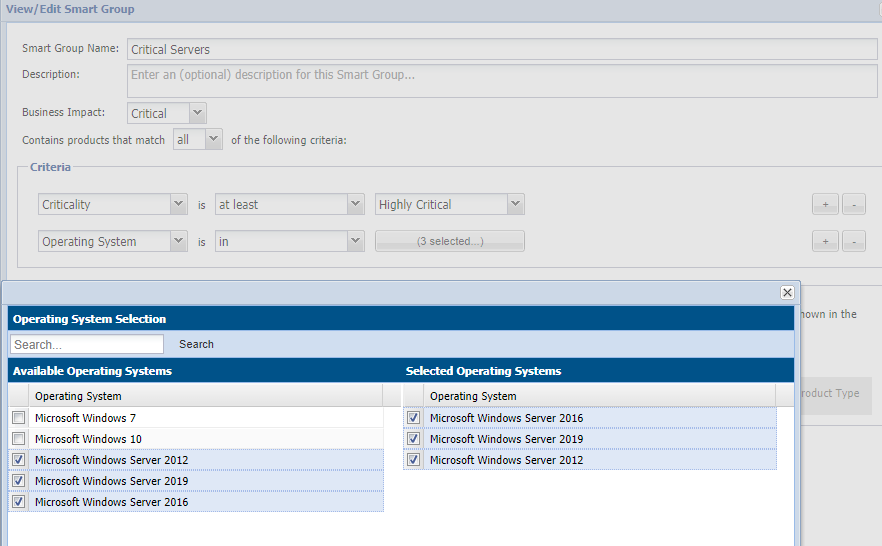
Critical Infrastructure Boundary Example
You can customize reports and dashboards that focus on your critical server infrastructure – vulnerabilities in the underlying Windows OS – using this smart group. To date in 2019, most Zero-Days are found in Microsoft’s OS software. It is critically important to maintain at least one view of those.
Track your servers separately than the rest
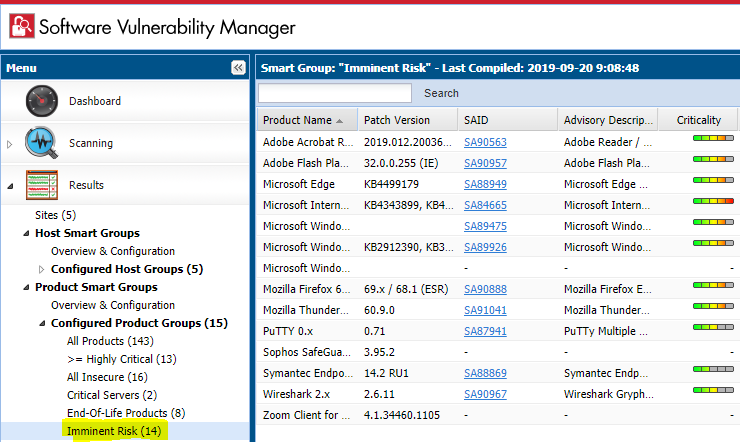
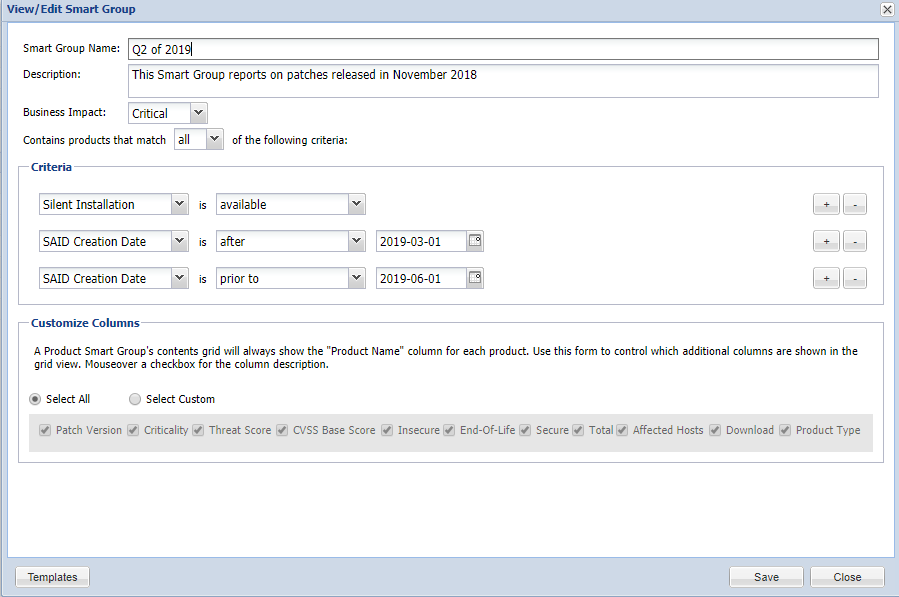
Tracking of Silently Installable Patches released in Q2
You can find out what patches have been released in the Q2 of 2019, or H1/H2, etc. This is a good way to keep track of what have been the latest security patches provided Out-of-the-box in the package system of the SVM, and you can also keep that as a log of the newest released updates (as numbers will update as new versions are released).
Track the software updates released between specific dates that are installable OOTB
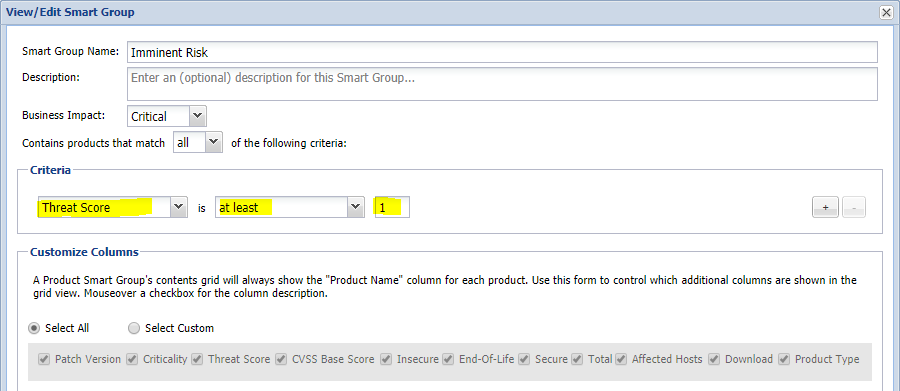
IT Compliance Quick Smart Group Configuration
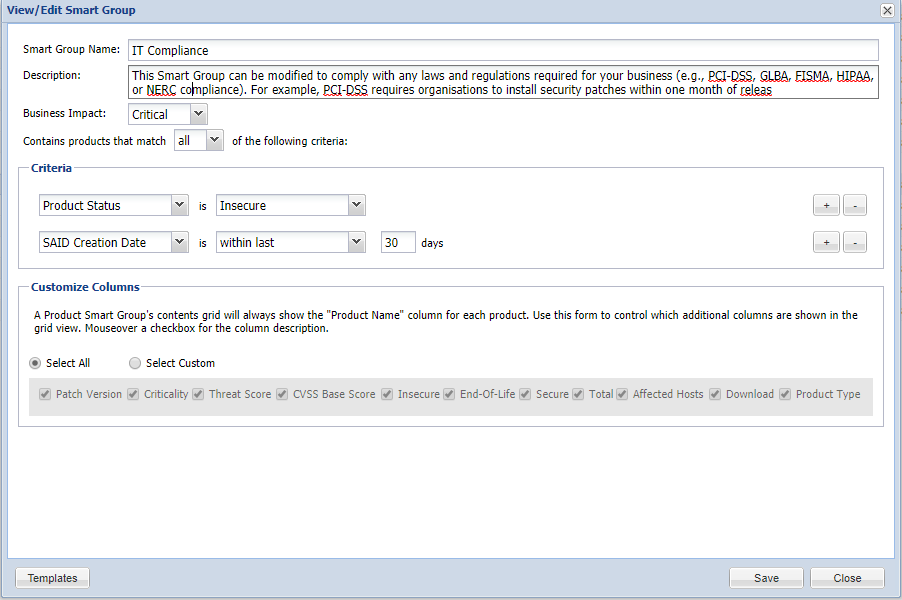
Example of SG configuration that helps you follow up on your compliance statuses
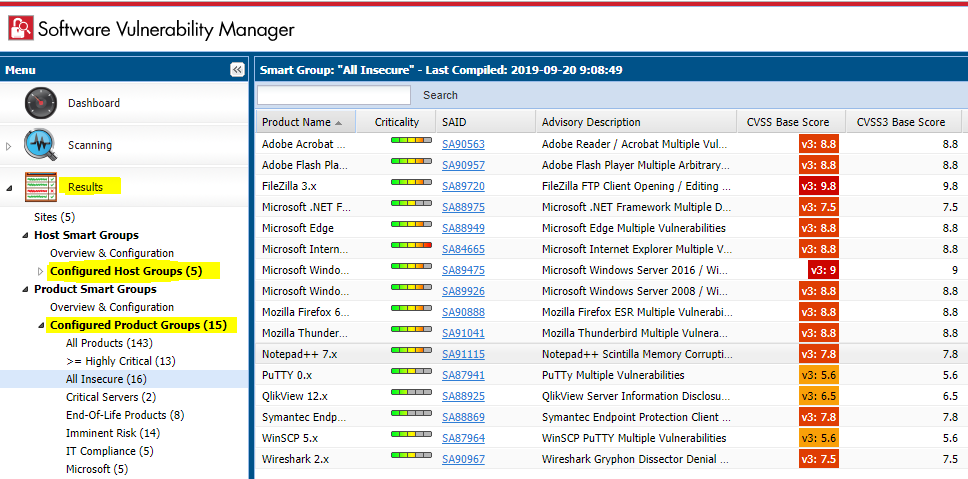
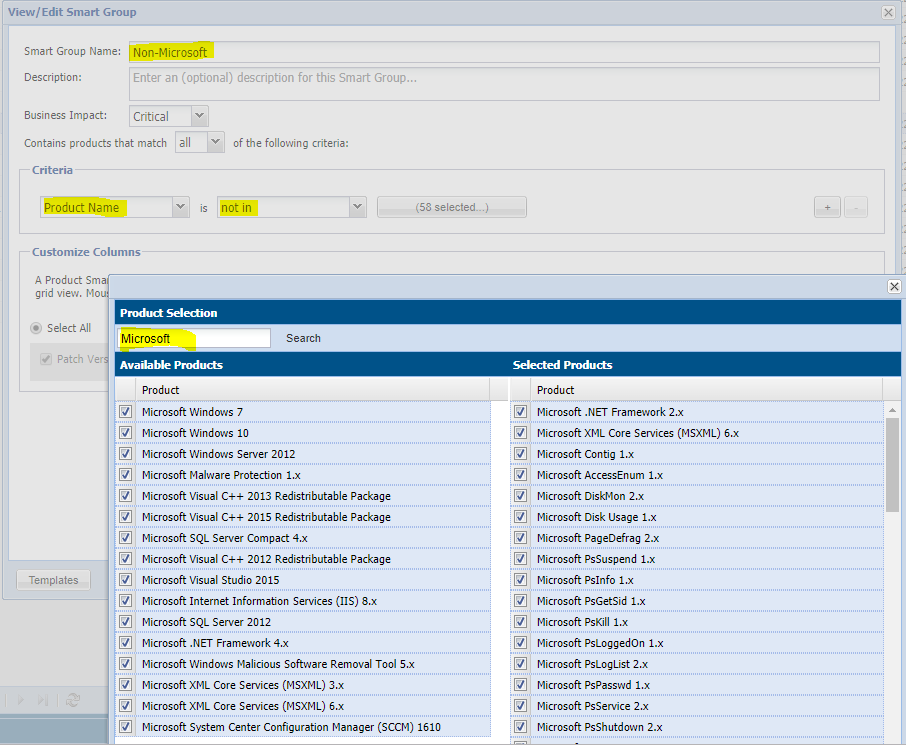
Smart Group for Non-Microsoft Patches
After you configure this group by using the “Not In” condition to remove all Microsoft apps (search for Microsoft, but also Windows for best results), the output will display only your third-party packages.
Therefore, this boundary will allow you to create Dashboards and reports which sum statistics only for third-party software taking Microsoft out of the equation.
A little tricky to configure, but extremely useful to separate views for 3rd party and Microsoft apps
You can create the same SG, but utilize the “In” condition while selecting all the same Microsoft apps, and this other SG will then show only Microsoft programs. Thus, you can switch the filters on the Dashboard to see differences, or simply build and save 2 different Dashboards with your favorite portlets that focus on each of the software types.
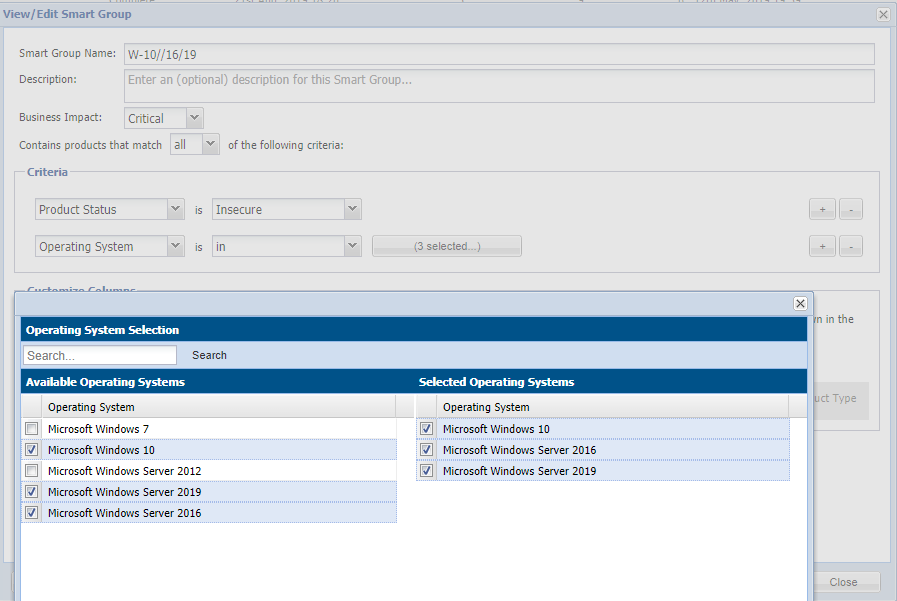
Tracking of Vulnerabilities found on the Windows W10 Platform
This smart group configuration can be helpful to track Windows 10 –level systems and OS vulnerabilities.
Related Articles
Understanding the “All Advisories” tab in a Product Smart Group 10Number of Views SVM Smart Groups Not Compiling - Manually Clean the SG Generation Queue [On-Prem] 13Number of Views SVM agents are checking in but not able to scan and report in SVM on-premise console. 6Number of Views VMware cluster inventory does not report both affine host group and anti-affine host group 4Number of Views Importing inventory from SCCM when SCCM has been customized to gather SQL Server edition information may cause temp databa… 4Number of Views
Hi, I am Reva - Ask me anything.
No new updates
Thanks for the feedback!
Your feedback has been saved.Rate this response:
Add Additional feedback ( Optional )
Are you sure you want to cancel
the case creation?
Are you sure you want to cancel the case creation?
Are you sure you want to close this case
| Products | Region | Phone Numbers |
|---|---|---|
| FlexNet Operations FlexNet Embedded FlexNet Publisher FlexNet Connect FlexNet Code Insight InstallAnywhere InstallShield |
North America * |
+1 630-332-2513 (toll) +1 877-279-2853 (toll-free in North America) |
| Europe * |
+44 1925 944367 (toll) +44 800 047 8642 (toll-free in Europe) |
|
| Japan * | +81 3-4540-5335 (select option 2) | |
| Australia * |
+61 3 9895 2177 +61 1800 560 603 (toll-free in Australia) |
|
|
Usage Intelligence (formerly
Revulytics) Compliance Intelligence |
Please use the Case Portal to submit your support ticket or reach out to your Revenera contact. | |
Case id: 00001065
Activity: Status change: 2 hours ago